Visualizing the Intangible
Leqi Liang
Data visualizations are often used to present tangible pieces of information and their relationship to one another. Since the medium often affects the output, I believe that experimenting with data visualizations will bring new possibilities for how to explain / reveal intangible information - information that is vaguer and more abstract in definition. For example: philosophy, the universe, religion, and psychology.
Modern data visualization uses binary language from computer technology to reveal fact, and I Ching uses the variation of Yin and Yang to reveal fact. Yin and Yang are like 0 and 1 in binary language, the simple pair of elements could build a solid way of communication. Besides, in visual design, straight lines and curves are also the origin of design elements. Cooperating these two fields is an experiment of telling the story of the intangible information from the universe.
Book overview
The book “the 3rd Side of the Coin” is aimed to visualize the process of finding the 3rd (Yin-Yang) side, by providing multiple perspectives of viewing the same content, so that the viewers are encouraged to change their points of view/perspectives/minds during their readings.
Detail of a formed I Ching hexagram
While reading the book, there are hidden hexagrams and quotes which can be formed from certain viewing angles. The pieced/reshaped contents are the metaphor of the idea of finding new perspectives of viewing the same thing.Multiple perspectives of viewing the book
This video documents the process of changing one’s perspective while viewing the book, like matching certain pages/page edges/pages from opposite sides/twisting the pages like a whole to different angles, etc.
Posters of “I Ching”
The pair of posters visualizes the stop motion morphing process of Chinese character “I Ching” with a collection of questions from different fields. It experiments if people’s shared doubts could be answered with different forms/states of I Ching concepts.The animated morphing process of Chinese character “I Ching”
I Ching’s morphing process contains its bluntest form to the sharpest form, which is the metaphor of the kindest character to the evilest character of one, like I Ching’s concept that the good can grow from the bad, and the bad can grow from the good, there is nothing absolute.
“I Ching” in different materials
Like the type morphing of “I Ching” symbolizes the variation of one’s characters, the change of the material of “I Ching” reflects more possible situations that the concepts of I Ching could be applied to.
Data visualization of the universe and religion
On the left poster, I used the flight paths of the stars and galaxies to visualize their dependency relationships to one another. On the right poster, I tried to use the cubes with different volumes to differentiate the degrees of importance of the terms and their interrelationships.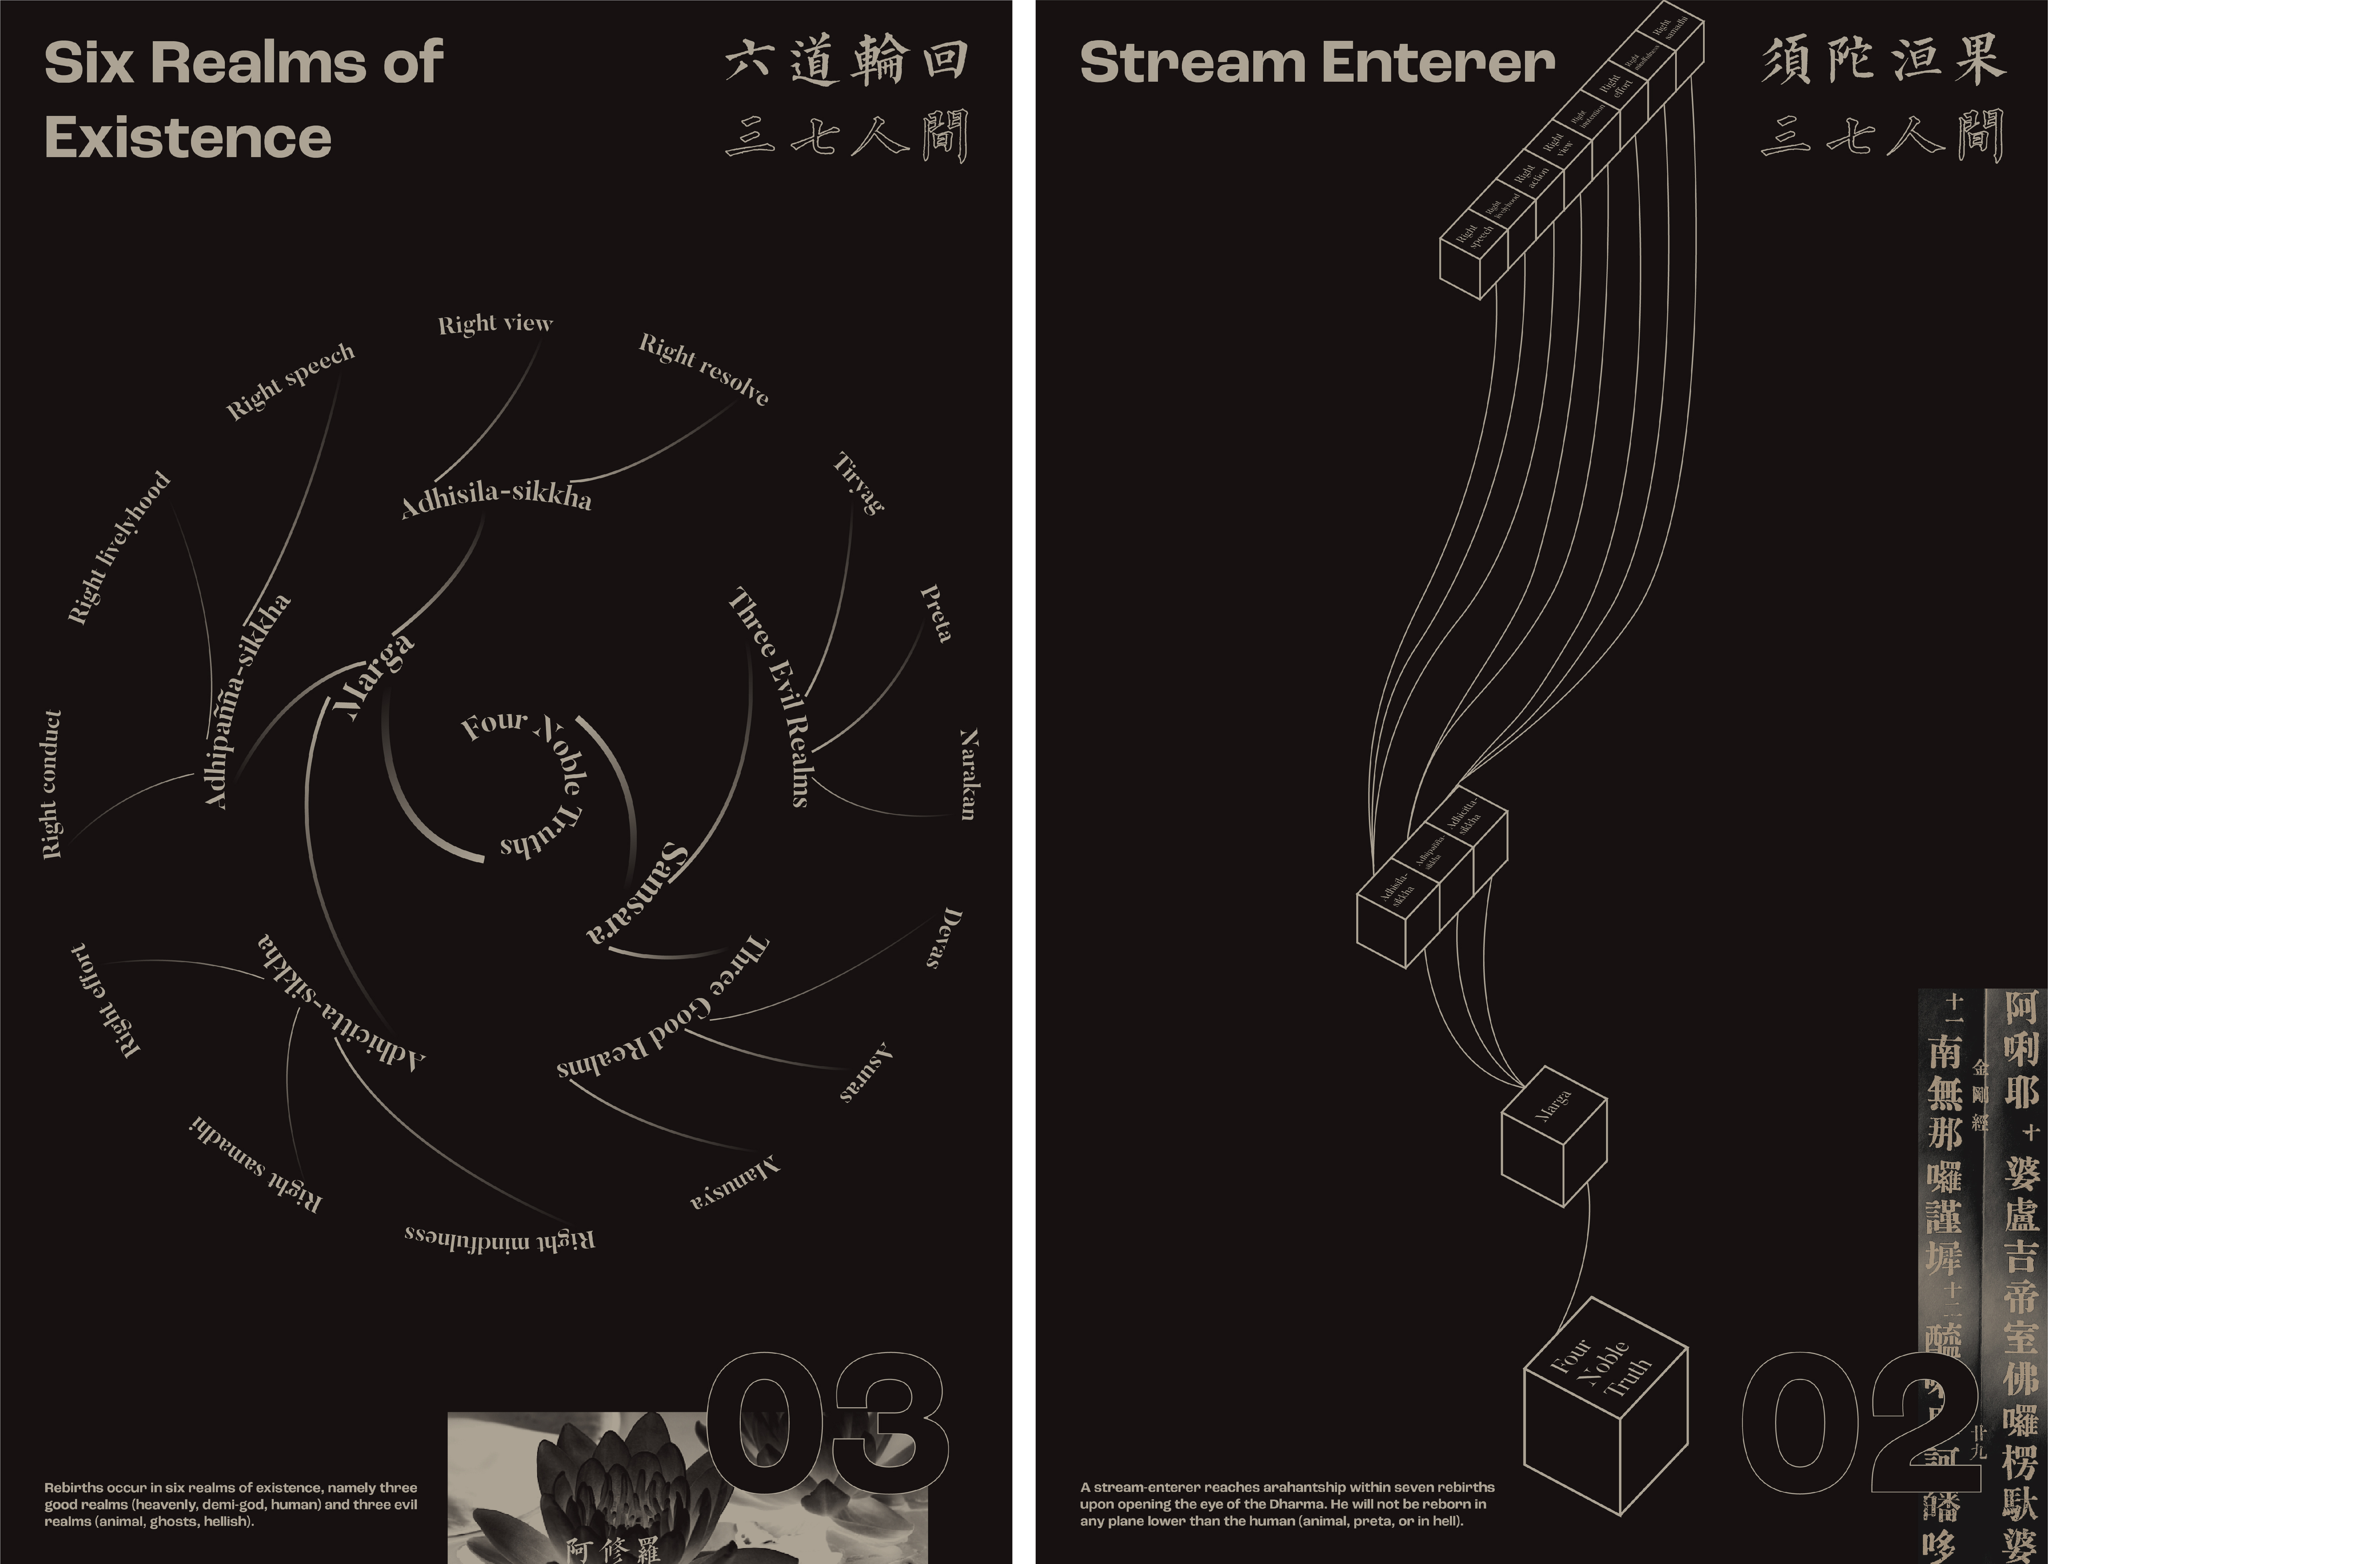
Data visualization of religion
The terms are from Tibetan Buddhism. On the left poster, the thickness of the lines and text sizes are used to differentiate the degrees of importance. And the right poster pairs with a previous one, which uses the same logic of structure to present another group of terms.
Data visualization of religion and philosophy
On the left poster, the inverted-color visual elements from Buddhism are used to present the variation of perspectives while viewing “intangible information”. On the right poster, I first symbolized different philosophy branches from my own understanding, and categorized the representative philosophers from the branches chronologically.